
Rate of Reactions
The rate of reaction refers to how quickly a chemical reaction proceeds and it is important because it determines the efficiency and safety of chemical processes in various industries. The rate of reaction can be measured in two primary ways:
- tracking the increase in amount of product produced per unit time
e.g. measure the amount of gas produced every 5 minutes - measuring the decrease in mass of the reactants within a vessel per unit time
e.g. measure the mass of the conical flask that the reaction is taking place in every 5 minutes
You can alter the rate of the chemical reaction by modifying any of these five rate of reaction factors: concentration, pressure, particle size, temperature and presence of catalyst.
Changing the rate of a chemical reaction affects how quickly the reaction reaches completion (the rate), but it does not alter the amount of product formed at the end (the yield). Imagine this: both you and a friend are both running 2.4km. You might run faster, finishing the race in a shorter amount of time, while your friend takes a slower pace, finishing later. Despite the difference in speed, both of you cover the same distance of 2.4km. Similarly, in chemical reactions, speeding up or slowing down the reaction rate through various factors like temperature or catalysts doesn’t change the total amount of product produced.
Rate of Reaction graphs
This rate of reactions chapter is one that is packed with graphs and tables, making it rich in visual data representation. Let’s start with graphs.
Following the two ways that can be used to measure the rate of reaction (see above), there are two types of graphs to visualise these measurements:
- An ascending graph, where the amount of product produced is plotted against time (which is increasing)
- A descending graph, where the mass of the reactant or vessel is plotted against time (which is decreasing)
The table below shows the general setup and illustrative graphs for both methods of measuring the rate of reaction. I have highlighted the essential features of the graph below it, with the most critical aspect being the gradient of the graph as it shows us the rate of reaction.
| Set-up | Graph | |
Measuring the increasing volume of product (gas) formed over time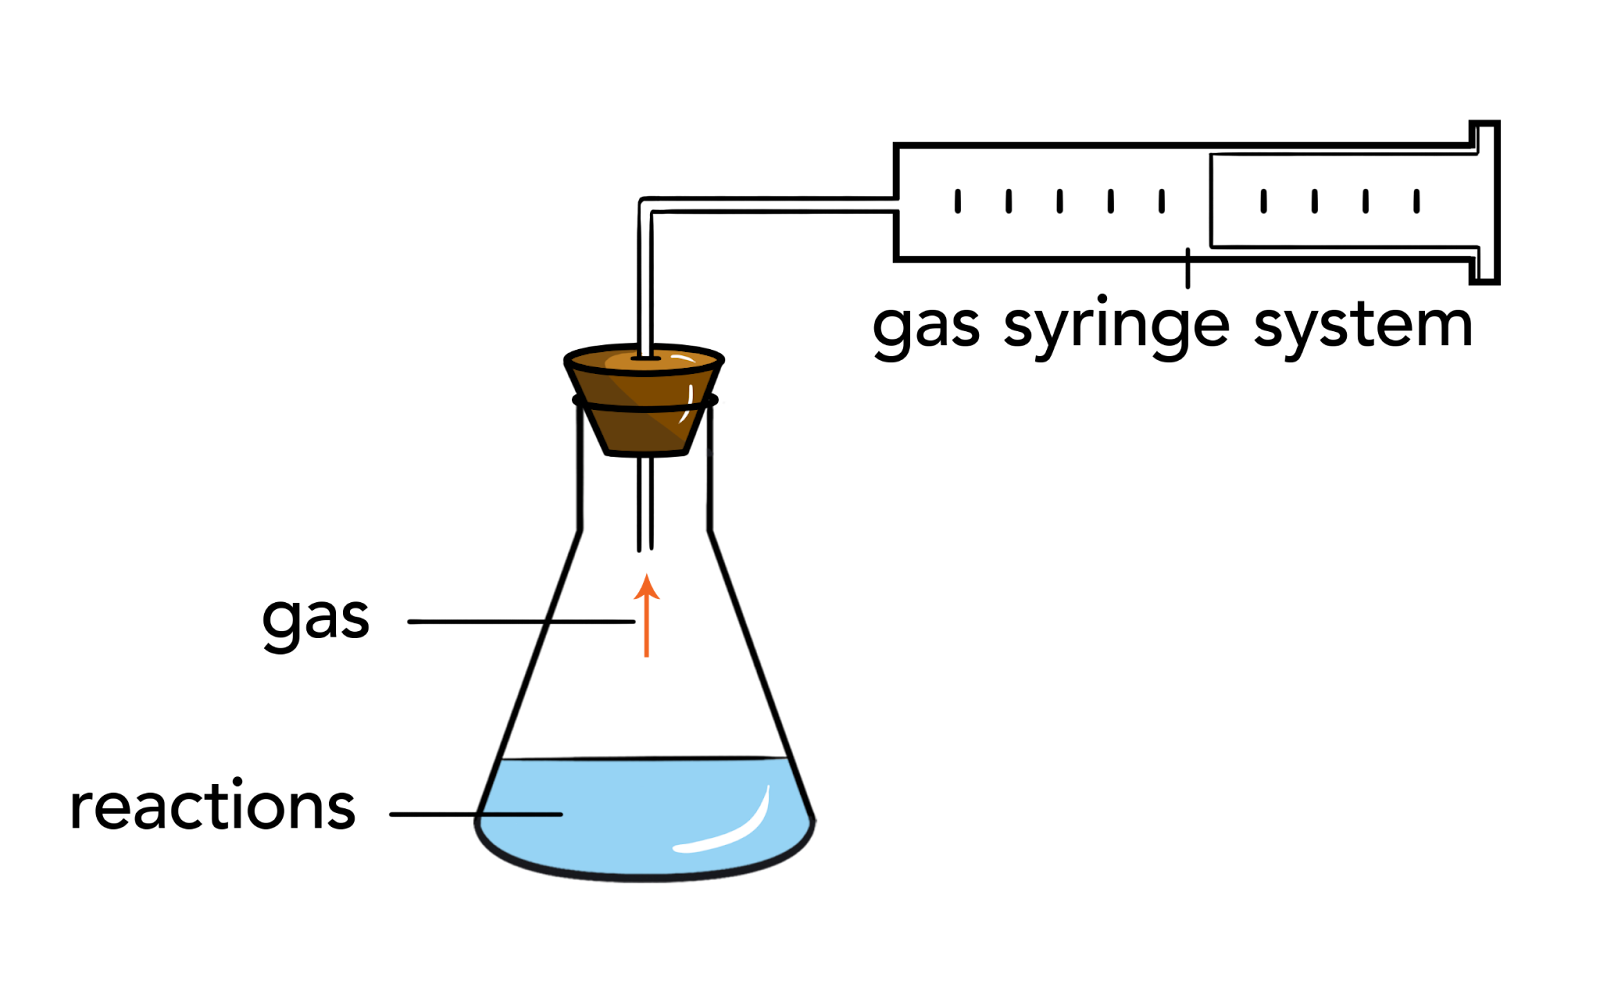 | 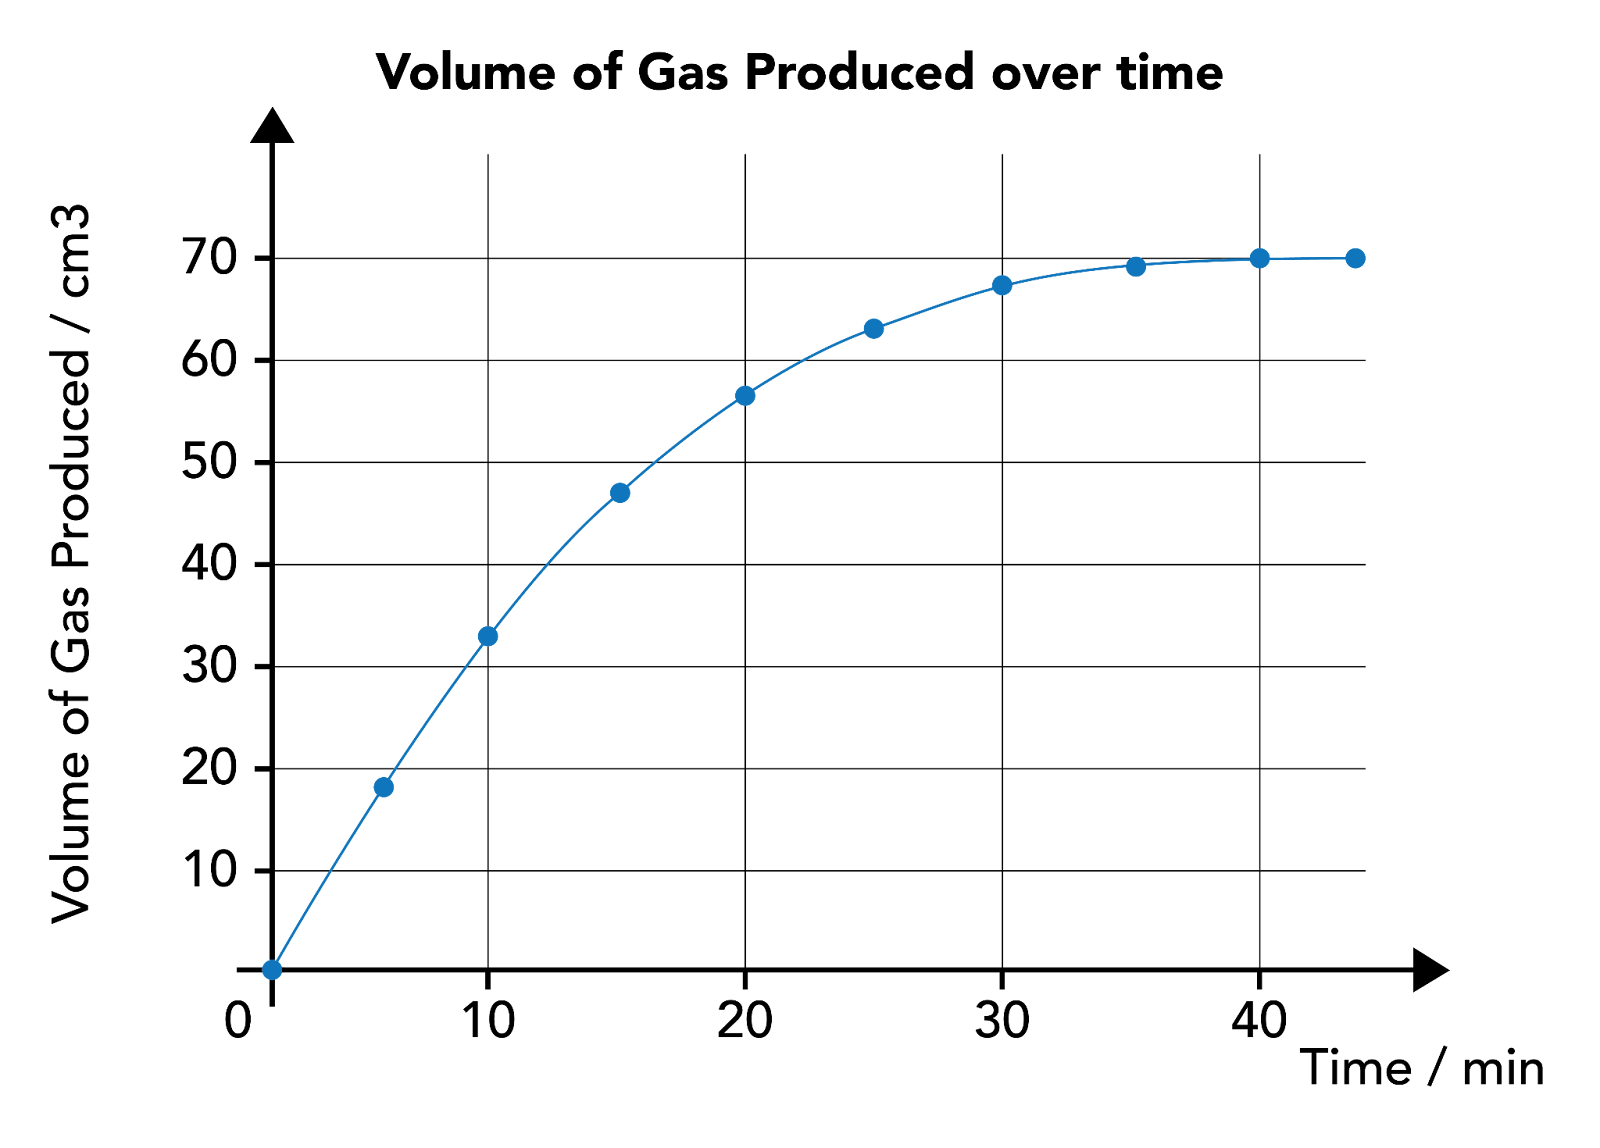 This rate of reaction graph measures the volume of gas produced over time, which is generally increasing. The gradient of the graph shows us the rate of reaction, which is steepest in the beginning, gentler in the as the reaction progresses, and zero at the end. The gradient of the graph is the steepest in the beginning, as the rate of reaction is the fastest when the concentration of reactants is the highest. As the reaction progresses, the gradient of the graph becomes gentler, indicating a slowdown in the rate of reaction due to the decrease in concentration of reactants. Finally, the gradient reaches zero as the reaction comes to a stop, signifying that all the reactants have been consumed. | |
Measuring the decreasing mass of reactant/vessel over time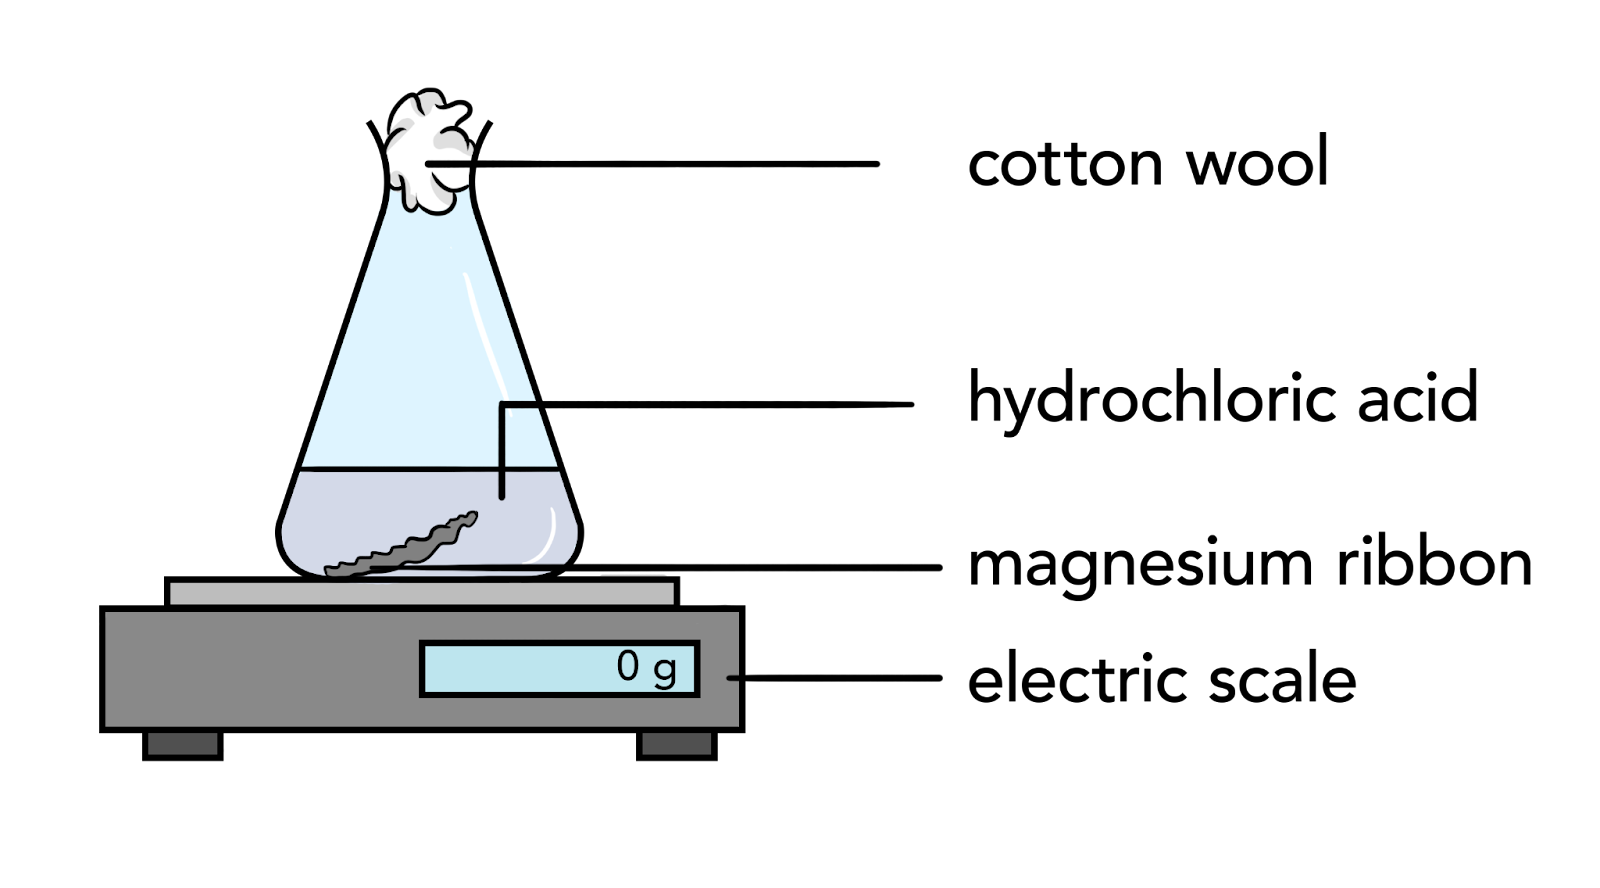 | 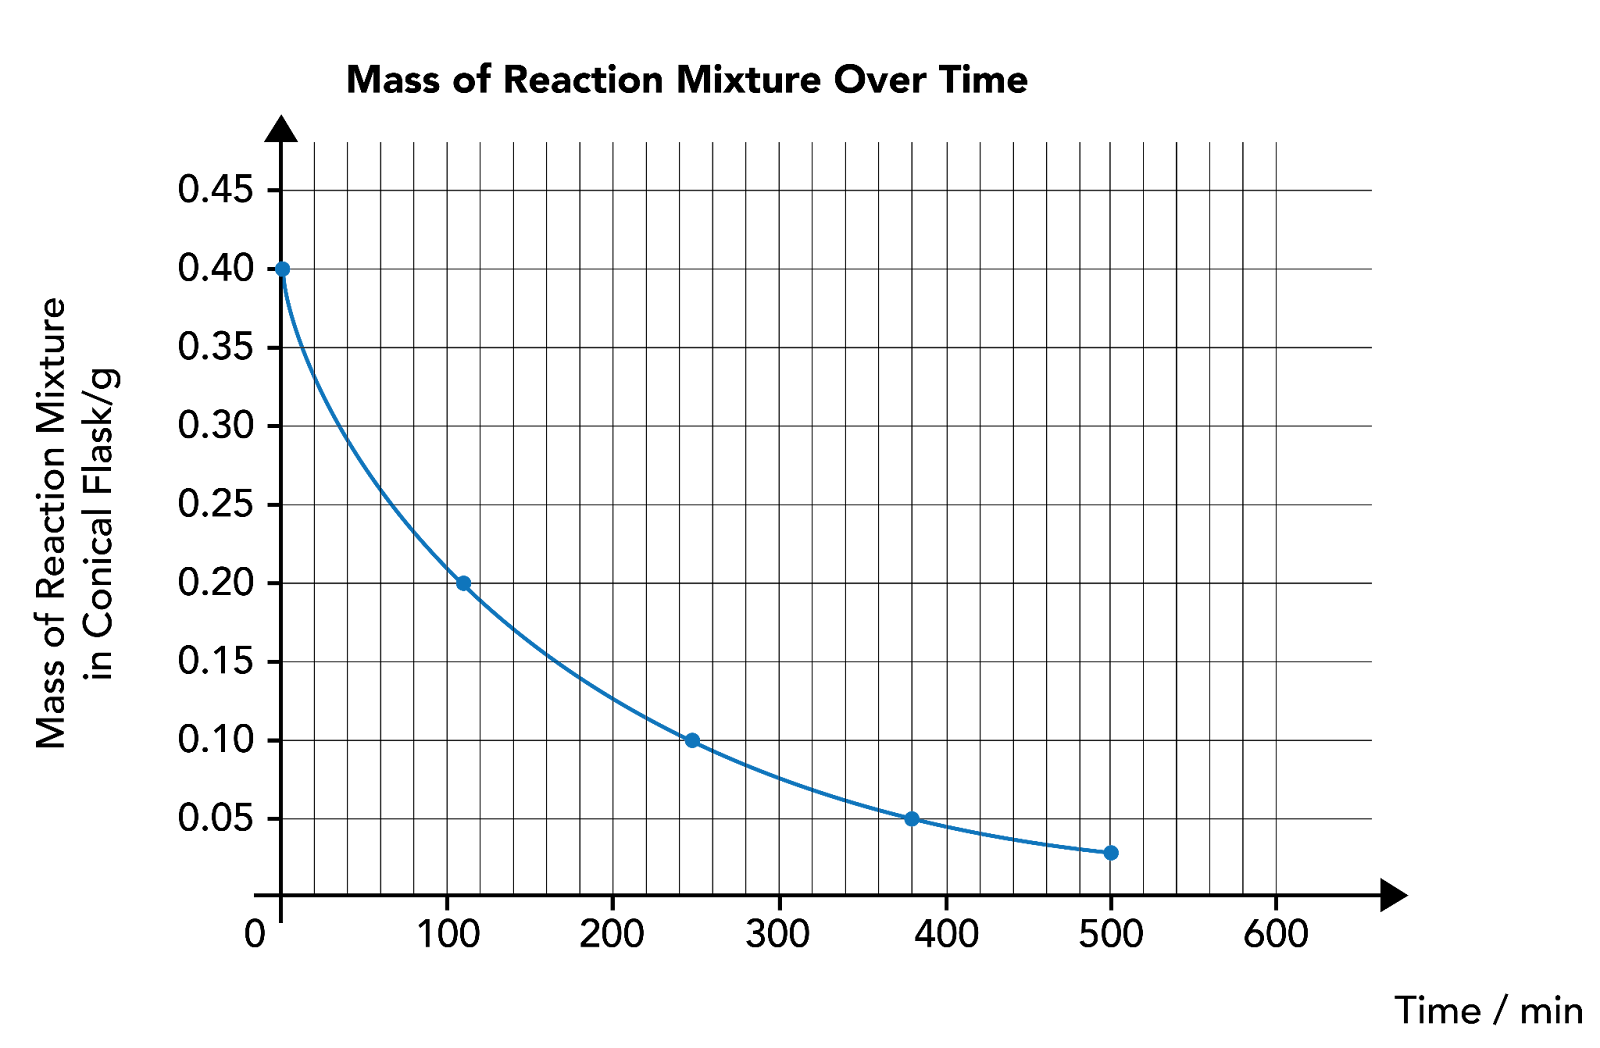 This rate of reaction graph measures the mass of reactants over time, which is generally decreasing. The gradient of the graph indicates the rate of reaction, starting out steepest in the beginning, becoming gentler as the reaction proceeds, and eventually reaching zero. The gradient of the graph is the steepest in the beginning, as the rate of reaction is the fastest when the concentration of reactants is the highest. As the reaction progresses, the gradient of the graph becomes gentler, indicating a slowdown in the rate of reaction due to the decrease in concentration of reactants. Finally, the gradient reaches zero as the reaction comes to a stop, signifying that all the reactants have been consumed. | |
In summary
This chapter on the rate of reactions introduces two types of graphs to illustrate the measurements of reaction rates: (1) an ascending graph showing the increase in product over time and a (2) descending graph depicting the decrease in reactant mass over time.
Key to understanding these graphs is the gradient, which indicates the reaction rate. In the beginning, the gradient is steepest, showing a fastest reaction rate due to high reactant concentration. As the reaction proceeds, the gradient becomes gentler, reflecting a slowdown as reactant concentration decreases. Eventually, the gradient flattens to zero, marking the reaction’s completion when all reactants have been converted to products. Altering one of the five factors that affect the rate of reaction while keeping everything else constant (concentration, pressure, particle size, temperature and presence of catalyst) will only alter the gradient of the graph and not the final amount of product formed.
Example question 1
IP/NYGH/Y4/EOY/2021/Q14
| A beaker containing an acid was reacted with an excess of zinc foil. The mass of the reaction mixture was recorded against time and the results plotted on a graph as shown in line P below. What change in conditions could result in the line Q shown on the graph? 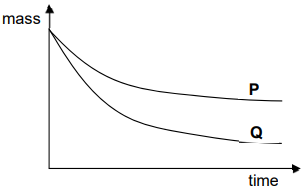 ARaising the temperature of the acid solution.BUsing a greater volume of acid with the same concentration.CUsing the same mass of zinc powder instead of zinc foil.DUsing the same volume of acid with greater concentration. ARaising the temperature of the acid solution.BUsing a greater volume of acid with the same concentration.CUsing the same mass of zinc powder instead of zinc foil.DUsing the same volume of acid with greater concentration. |
Ans: D
Guiding questions:
- How do the gradients (rate of reaction) of the two graphs differ?
- How do the endpoints (amount of product produced) of the two graphs differ?
Explanation:
- The gradient of graph Q is steeper than the gradient of graph P → Q shows a faster rate of reaction → This suggests that a factor influencing the rate of reaction was altered to accelerate the process in Q.
- The endpoint of graph Q is lower than P → Q starts out with less amount of reactants → This suggests that a factor influencing the quantity of reactants was altered such that more products were produced in Q.
- Conclusion: the “change in conditions could result in the line Q shown on the graph” the question asks for should affect both the rate of reaction and amount of product formed
A is incorrect as this factor only affects rate but does not affect yield
B is incorrect as this factor only affects yield but not rate (concentration is the same).
C is incorrect as this factor only affects rate but does not affect yield
D is correct this factor affects both rate and yield.